The Return of Pure Price Action
As November 2025 unfolds, traders across global markets are rediscovering the art of trading from the chart — the ability to interpret market structure and momentum without overreliance on forecasts, algorithms, or headlines. In an environment where news cycles shift by the hour and central bank signals create constant noise, charts remain the most honest reflection of market psychology. Every candle, every consolidation, every breakout tells a story of fear, greed, and imbalance.
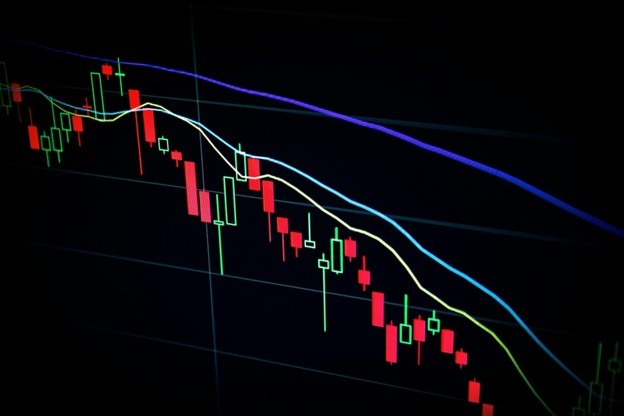
This month has reminded even experienced professionals that price action itself is the truest signal. The major indices, particularly the Nasdaq and S&P 500, have seen heavy intraday swings, with rapid reversals erasing hours of progress in seconds. For traders relying on fundamental narratives, the pace feels impossible to follow. But those who understand how to trade directly from the chart — focusing on levels, structure, and tempo — find opportunity in every swing.
Trade from chart is not about prediction; it’s about reaction. It begins with awareness — identifying where liquidity lies, where buyers defend, and where sellers attack. In November’s volatile conditions, the most successful trades have come from recognizing when momentum is exhausted and when a breakout has true strength behind it. Chart-based trading demands discipline and patience: the skill to wait for confirmation and the courage to act when it arrives.
Reading Market Structure in Real Time
Charts are living systems, not static pictures. Each timeframe carries its own language — short-term charts reveal market emotion, while longer ones reveal conviction. This month, intraday traders are relying heavily on 15-minute and hourly charts to capture bursts of volatility, while swing traders prefer daily structure to identify trend continuity. Regardless of timeframe, the logic remains the same: markets move in impulses and corrections, and understanding that rhythm is key to anticipating behavior.
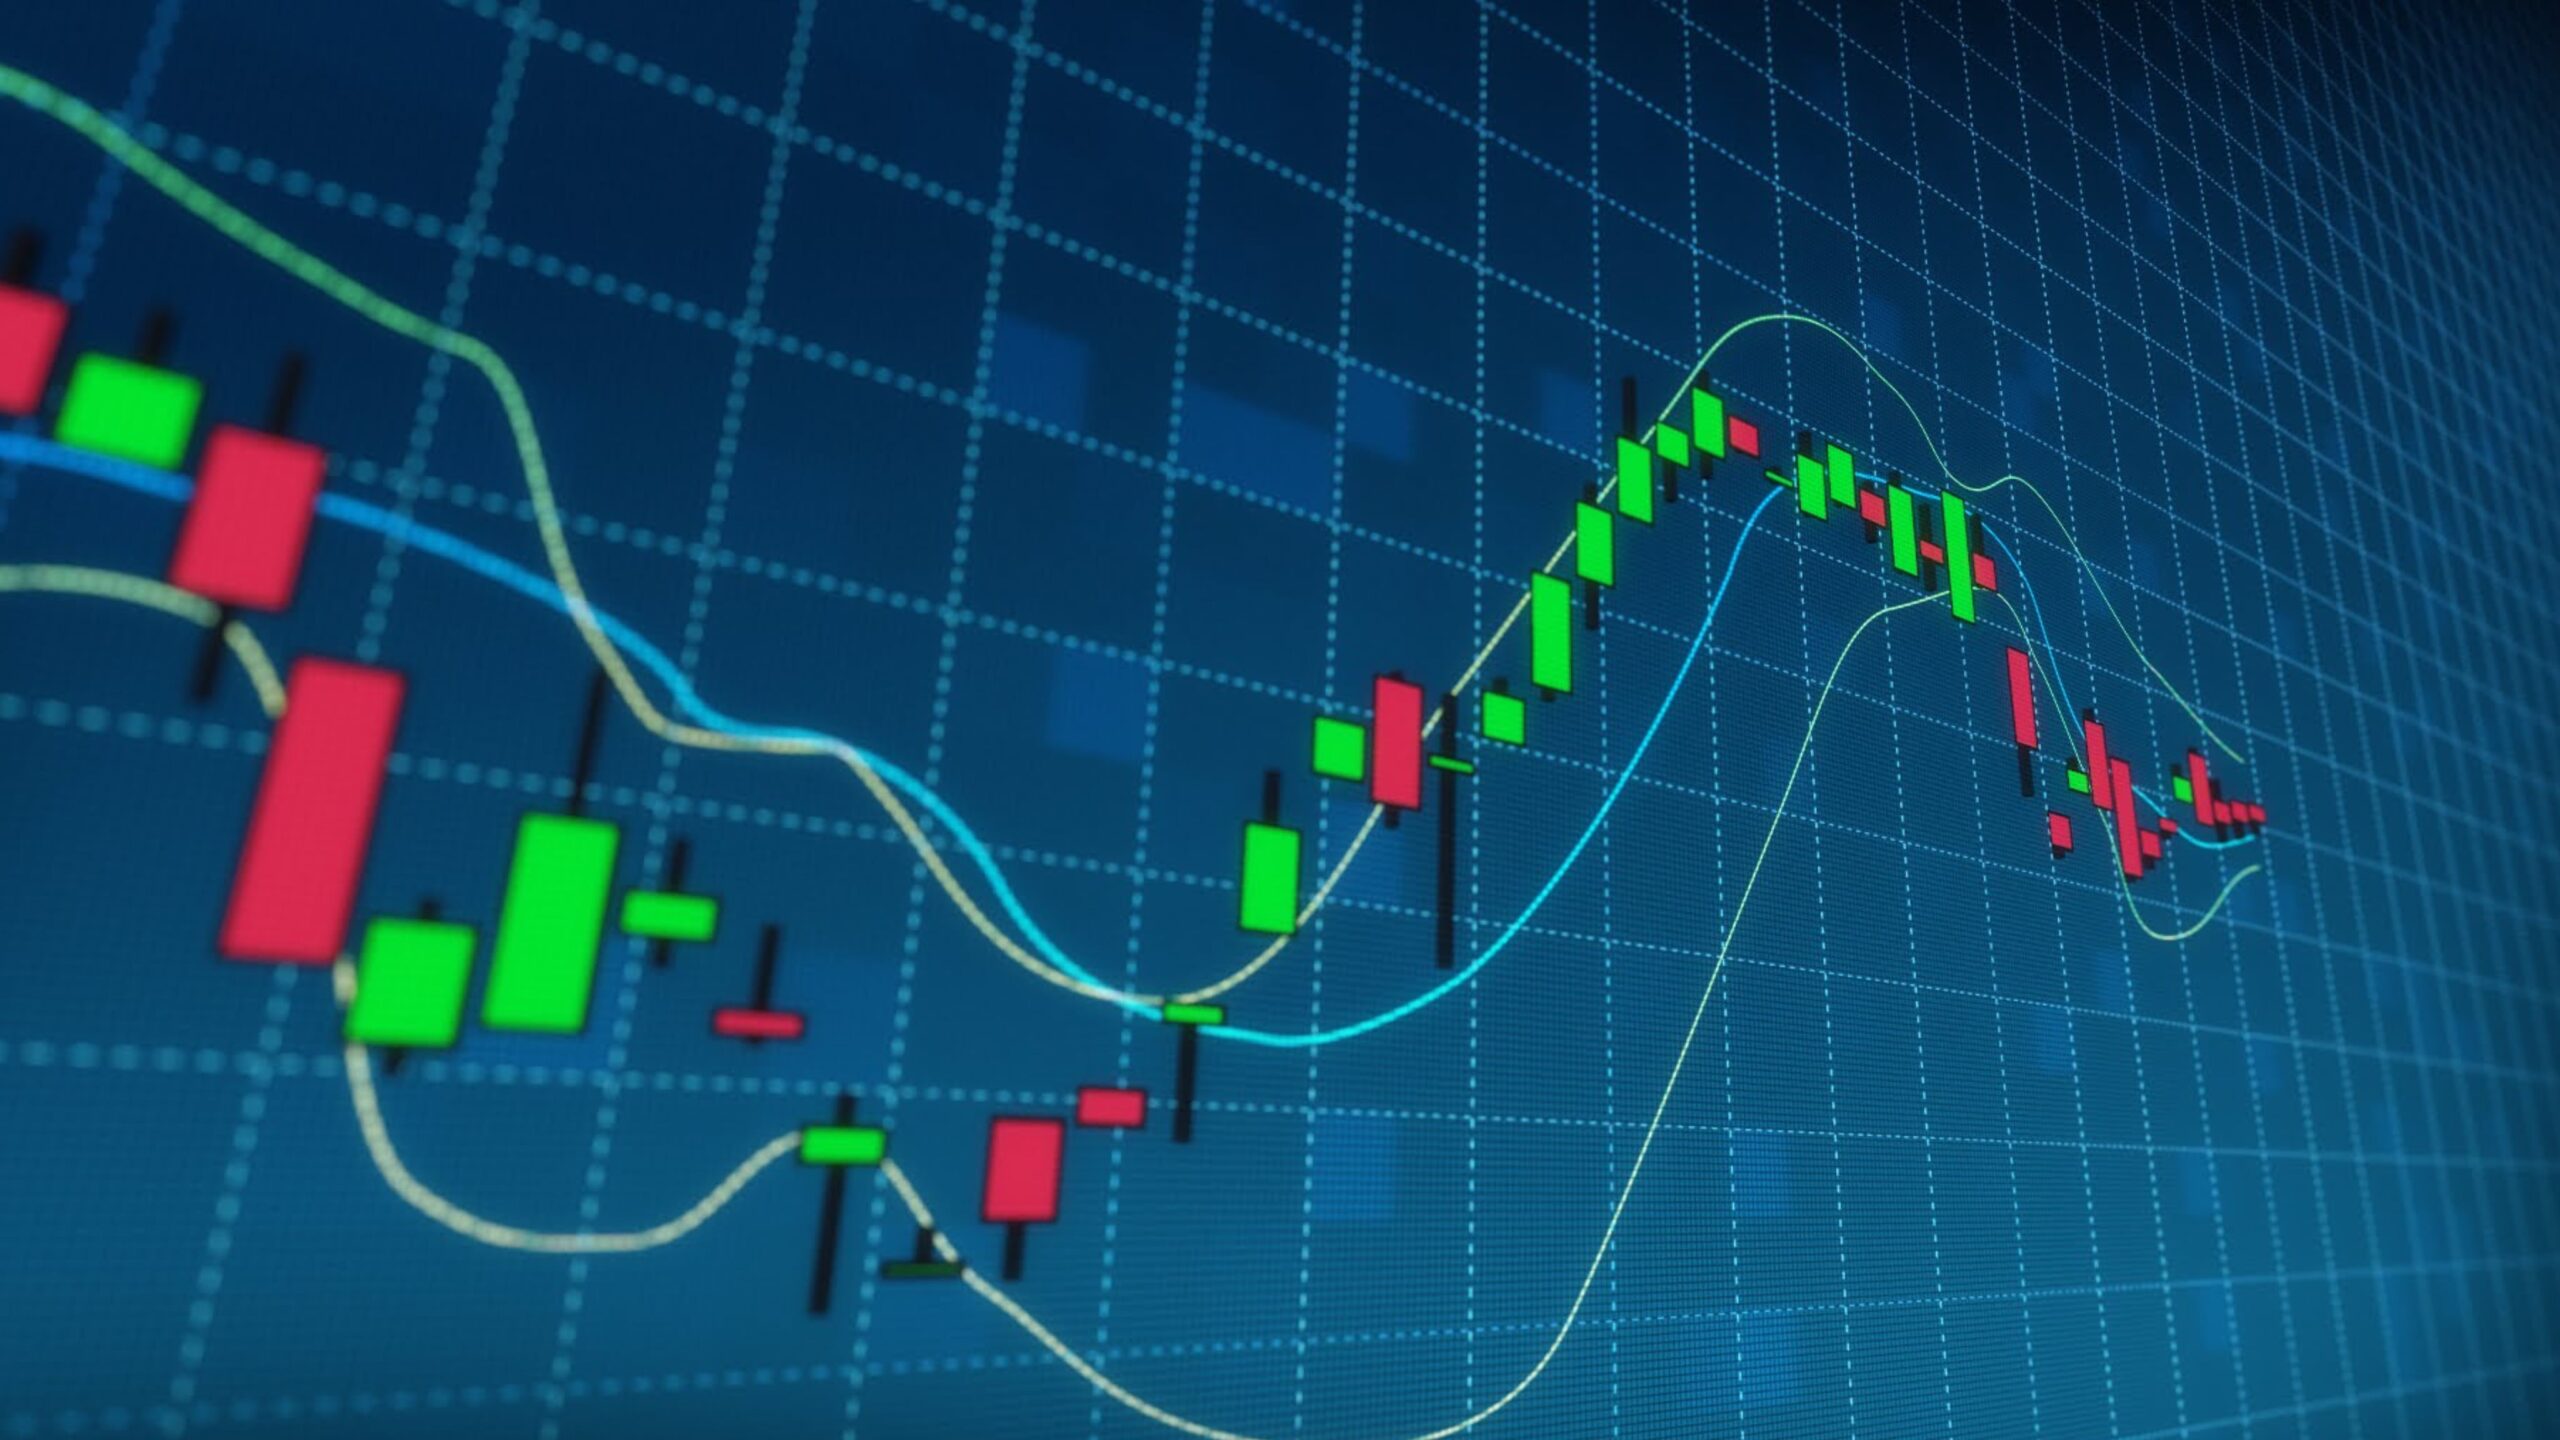
Support and resistance zones continue to define market psychology. When a price tests a level repeatedly, it is not randomness — it’s the memory of past transactions, the echo of previous conviction. Traders reading directly from the chart are mapping these levels manually, drawing zones rather than lines, because markets rarely respect precision but often respect areas. Candlestick formations — engulfing bars, pin rejections, inside candles — provide the microstructure that reveals whether liquidity is being absorbed or rejected.
In November 2025, traders have learned to adapt to erratic volume patterns. Economic data releases, earnings calls, and central bank speeches create sudden bursts of liquidity that distort short-term structure. The disciplined chart trader knows not to fight these moments but to observe them, waiting for volatility to settle and clarity to return. Often, the best trade occurs after the event, once the chart shows whether the market truly believes the news or simply overreacted to it.
Emotion, Timing, and the Flow of Market Psychology
Trading from the chart is ultimately about understanding human behavior. Every spike, dip, and consolidation is driven by emotion: the fear of missing out, the relief of exit, the panic of liquidation. November’s markets have been a masterclass in emotional extremes. Traders chasing moves too early have been punished, while those who waited for the market to show its hand have been rewarded.
Timing is what separates reactive traders from strategic ones. On the chart, timing isn’t about the clock — it’s about rhythm. When price compresses near a key level, tension builds. When it breaks, momentum releases. Reading that rhythm is more valuable than any indicator. Traders are using moving averages not as predictive tools but as guides for flow — where momentum aligns, where volatility expands, and where the path of least resistance lies.
The biggest mistake many make in volatile markets is trading opinions rather than evidence. The chart is evidence. It’s the record of every decision made by every participant — institutions, retail traders, and algorithms alike. When read correctly, it reveals imbalance before it becomes obvious. A sudden volume spike near a long-term resistance is not coincidence; it’s information. The skill lies in interpreting it before the crowd reacts.
Emotional control remains the foundation of chart-based trading. A trader who understands structure but lacks discipline will still fail. The best trades are often the least exciting — a quiet retest, a simple continuation. Yet they compound over time, while impulsive trades erode both confidence and capital.
Trading from the Chart in Practice
In November’s high-volatility environment, trading directly from the chart has proven to be both challenging and liberating. Without the distraction of endless forecasts, traders focus purely on what price is doing now. Whether in stocks, forex, or CFDs, the process is universal: define structure, wait for confirmation, manage risk, and execute with precision.
Chart trading thrives in volatility because it adapts instantly. When news shifts sentiment, the chart reacts within seconds — faster than any analyst or headline. Traders who anchor their decisions in visual structure rather than external opinion can navigate sudden reversals without panic. In the current market, where spreads are tight and liquidity deep, these micro-decisions define profitability.
For example, a trader watching the Nasdaq CFD this month can see momentum compressing between key levels. A clean breakout from that structure — supported by increasing volume — is often all the confirmation needed. No prediction, no guesswork, only observation. Similarly, in forex pairs like GBP/USD, identifying areas of rejection and absorption gives insight into where major participants are entering.
Risk management completes the system. Trading from the chart means each position must have a defined point of invalidation — a place where the idea no longer makes sense. Stops protect traders not just from loss, but from themselves. The goal isn’t to win every trade, but to execute every trade correctly. Over time, that discipline compounds more powerfully than any winning streak.
As November moves toward its close, markets remain fluid, but the principles endure. The chart is the most democratic of all indicators — it shows everything and hides nothing. In the end, the traders who thrive are those who treat the market not as a puzzle to solve, but as a language to read.